


Psychographic segmentation groups customers by why they buy — their values, lifestyle, personality, interests, attitudes and buying motivation — rather than by who they are or what they did. Demographics tell you a buyer is 34 and earns $95,000. Behavioral data tells you she bought a $1,290 gravel bike in March. Psychographics tell you she bought it to quit her commute, not to race on weekends — and that is the difference between an ad that converts and one that does not.
Two buyers can fill identical rows in your CRM and cancel for opposite reasons. Closing that gap is the entire job. What follows is the operating manual: the six traits and where each one is actually collected, the four frameworks worth knowing, a five-step build process with sample sizes and statistical methods named, three worked examples, and the failure modes that quietly waste research budgets.
The six traits, and where each one lives
Most introductions name the variables and stop, which leaves you with a vocabulary lesson and no way to collect anything. Each row below pairs a trait with a concrete example and the source you would realistically pull it from.
| Trait | What it tells you | Worked example | Where the data comes from |
| Values | What a buyer believes is worth paying for | Patagonia’s “Don’t Buy This Jacket” campaign asked shoppers to buy less, which spoke directly to people who rank durability above novelty | Agree/disagree survey batteries you write yourself; the Schwartz values inventory for a validated baseline |
| Lifestyle | The routine your product has to fit inside | A 6 a.m. gym member and a 9 p.m. gym member need different class schedules, different app nudges and different renewal offers | Large syndicated studies such as MRI-Simmons, plus your own usage timestamps |
| Personality | Risk appetite, need for structure, tolerance for complexity | Cautious, detail-driven buyers choose the plan with the setup checklist; curious ones ask for beta access | Big Five (OCEAN) inventory items dropped into onboarding |
| Interests | The topics and communities a buyer already follows | A cast-iron cookware brand finds its people in sourdough and camping communities, not in a generic “cooking” audience | Google Analytics 4 affinity and in-market segments; follower-overlap analysis |
| Attitudes | Beliefs about your category and its trade-offs | “Security matters more to me than convenience” splits a fintech list into two email tracks needing different subject lines | Likert-scale surveys, NPS verbatim comments, mining reviews on your own product pages |
| Buying motivation | The job the purchase is hired to do | Two people buy the same $180 running shoe: one to finish a marathon, one to survive a 12-hour nursing shift | Switch interviews with buyers who recently changed providers |
Three data types, three different questions
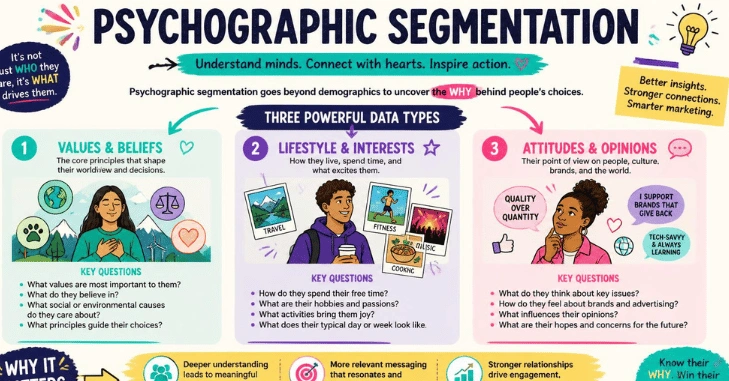
| Data type | Question it answers | Example | Strength | Weakness |
| Demographic | Who is this person? | 34, female, $95k income, Denver | Cheap, universally available, easy to target | Says nothing about motive; two identical rows behave oppositely |
| Behavioral | What did they do? | Bought twice, opened 4 of 12 emails, churned in month 7 | Objective, already in your database, predictive short-term | Describes the past; explains nothing about why |
| Psychographic | Why did they do it? | Bought to replace a car commute; values independence over speed | Explains motive, drives messaging, product and pricing | Expensive to collect, self-reported, decays over time |
The three are complements, not competitors. The strongest segmentation work uses demographics to size and reach a group, behavior to validate that the group is real, and psychographics to decide what to say to it.
Four frameworks worth actually knowing
1. VALS
Developed at SRI International and now maintained by Strategic Business Insights, VALS places US consumers on two axes: primary motivation (ideals, achievement, or self-expression) and resources and innovation. That grid produces eight types — Innovators, Thinkers, Believers, Achievers, Strivers, Experiencers, Makers and Survivors.
Its value is as a shared vocabulary and a sanity check: if your five homegrown segments map onto only one VALS motivation, you have probably segmented on surface preference rather than on motive. Its limit is that it is US-centric and generic to the whole economy, so it will never be as sharp as a category-specific study you run yourself.
2. The Schwartz theory of basic human values
Shalom Schwartz’s model identifies ten broad values — self-direction, stimulation, hedonism, achievement, power, security, conformity, tradition, benevolence and universalism — arranged in a circle where adjacent values are compatible and opposite values conflict. It is validated across dozens of countries, which makes it the most defensible starting point for international work.
The practical payoff is the conflict structure. Security sits opposite stimulation; achievement sits opposite benevolence. If your positioning tries to claim both ends of an axis at once — “the safest way to take a bold risk” — the model tells you why the message keeps testing flat.
3. Jobs to Be Done
JTBD reframes the customer entirely: people do not buy products, they hire them to make progress in a specific situation. The interview method that supports it — the switch interview — reconstructs the timeline of a real purchase and looks for four forces: the push of the current situation, the pull of the new solution, the anxiety about switching, and the habit holding the person in place.
Of the four frameworks this is the one that most reliably changes a roadmap, because it surfaces the anxiety that is blocking otherwise-willing buyers. Ten to fifteen interviews with recent switchers usually reach saturation.
4. AIO and the Big Five
AIO — Activities, Interests, Opinions — is the classic lifestyle-survey structure from Joseph Plummer’s 1974 work, and it remains the practical template for writing psychographic survey batteries. Pair it with Big Five personality items (openness, conscientiousness, extraversion, agreeableness, neuroticism) when you need trait-level differences: conscientiousness in particular predicts response to detailed onboarding, guarantees and checklists.
Build your first segments in five steps

Step 1: Write the hypothesis before you write the survey
Start with a sentence of this shape: “We believe our buyers split into people who hire us for X and people who hire us for Y, and the two need different [messaging / pricing / features].” If you cannot finish that sentence, you are not ready to field a survey — you are ready to run ten switch interviews.
Step 2: Collect from three sources, not one
- Qualitative first. Ten to fifteen switch interviews with customers who bought or churned in the last 90 days. Their language becomes your survey wording, which matters more than most teams expect.
- Quantitative second. A 15–25 item Likert survey, five or seven points, mixing values, attitudes and motivation statements. Keep it under five minutes or completion collapses.
- Behavioral third. Join survey responses to actual account data so you can test whether the segments differ on retention, order value and support load.
On sample size: aim for roughly 400 complete responses for a total-sample margin of error near ±5% at 95% confidence, and at least 100–150 responses per segment you expect to find. Clustering on 60 responses produces segments that will not replicate.
Step 3: Cluster, then name
Two methods cover nearly all practical work. K-means is fast and easy to explain, and you choose the number of clusters using an elbow plot or silhouette score. Latent class analysis is more rigorous, handles categorical responses properly, and gives you fit statistics (BIC) to justify the cluster count — use it when the segmentation will drive real budget.
Then name them in the customer’s language, not yours. “The Commuter Convert” beats “Segment 3” in every internal argument you will subsequently have, and it is the reason segments survive contact with a marketing team.
Step 4: Apply Kotler’s viability tests
A segment has to pass five checks before it earns a budget line:
- Measurable — you can size it
- Substantial — it is big enough to be worth serving
- Accessible — you can actually reach it through some channel
- Differentiable — it responds differently from the other segments
- Actionable — you can build a program for it with the resources you have
Most failed segmentation projects fail on accessible and actionable, not on the statistics.
Step 5: Activate and validate
Activation means: distinct ad creative per segment, distinct email tracks, distinct onboarding paths, and a segment field written back into the CRM. Validation means holding out a control group and measuring whether segment-targeted messaging beats generic messaging on conversion rate and 90-day retention. If it does not, the segments are decorative.
Three brands that group people by motive

Patagonia segments on values rather than outdoor activity. Its Worn Wear repair-and-resale program, its lifetime repair guarantee and the 2011 “Don’t Buy This Jacket” ad all address one belief — that buying less and keeping longer is the right thing to do. A demographic segmentation of “outdoor enthusiasts, 25–54” would produce none of that program.
Peloton segments on motivation inside an identical demographic. The same affluent, time-poor buyer profile splits cleanly into competitors who care about leaderboard position and output numbers, and escapers who want thirty minutes where nobody needs anything from them. The instructor roster, the class taxonomy and the badge system exist to serve both without either feeling that the product is aimed at the other.
Notion segments on personality and tolerance for complexity. Its template gallery is a direct response to the finding that a large portion of prospects want structure handed to them, while a smaller, louder group wants a blank canvas. Same product, two entirely different first-run experiences, driven by a psychographic read rather than by company size.
A worked example, end to end
Take a direct-to-consumer gravel bike brand, average order value $1,290, roughly 4,000 orders a year.
Hypothesis: buyers split between people replacing a car and people adding a sport.
Research: 12 switch interviews plus a 19-item survey to the customer list, 640 completes.
Result: latent class analysis returns three segments.
| Segment | Share | Core motivation | What it changes |
| Commuter Converts | 41% | Replace a car journey; value reliability and low maintenance | Lead with rack and fender compatibility, tire clearance, service intervals. Bundle lights and locks. |
| Weekend Racers | 34% | Improve on a measured performance; value weight and components | Lead with frame weight, groupset spec, wheel upgrade paths. Event partnerships convert them. |
| Escape Riders | 25% | Get away from screens and obligations; value comfort and route access | Lead with ride comfort, bikepacking mounts, route guides. Photography-led creative, no spec sheets. |
Measured outcome to look for: segment-matched landing pages beating a generic page on add-to-cart rate, and a lower 12-month return rate among Commuter Converts once the product page stops selling them on race weight they never wanted.
Notice that none of these three segments is defined by age, income or ZIP code — and that all three are reachable, because each maps to distinct search intent, distinct content and distinct communities. That reachability is what makes the work usable rather than merely interesting; the same principle underpins how search visibility work targets intent rather than audience labels.
Where psychographic segmentation breaks down
- Self-report bias. People overstate how much they value sustainability, health and thrift, and understate status and convenience. Weight stated values against observed behavior before you build a campaign on them.
- Segments you cannot reach. “Values craftsmanship, distrusts advertising” is a perfectly real segment and an almost untargetable one. Test reachability before you spend on the study, not after.
- Too many segments. Three to five is the working range. Seven segments means seven creative variants, seven email tracks and seven sets of results too thin to read.
- Segments that never leave the deck. If the segment is not a field in the CRM and a filter in the ad account, it does not exist operationally.
- Staleness. Attitudes shift with the economy and the category. Re-field the survey every 18–24 months; interests decay faster than values.
- Privacy and platform constraints. Third-party interest targeting has narrowed considerably, and sensitive-category inferences are restricted outright on the major ad platforms. Build segmentation on first-party data you collected with consent, and use it to shape creative and offers even where you cannot use it to shape targeting.
- Confusing a persona with a segment. A persona is a narrative illustration. A segment is a measurable group with a size, a share of revenue and a distinct response. Personas are useful only after the segments are real.
Start with one question, not a whole study
If a full research program is not funded, you can still get most of the value from one well-placed question. Add a single open field at checkout or in onboarding: “What made you look for this today?” Free text, optional, one line.
Two hundred answers, sorted by hand into recurring motives, will give you a first-pass segmentation that is more useful than any purchased persona deck — and the exact customer phrasing you need for ad copy. Everything else in this guide is a way of making that same insight statistically defensible at scale. More on turning audience insight into acquisition work sits in our digital marketing section, and specifically in our look at how SEO expert services shape modern digital marketing.
Key takeaways
- Psychographic segmentation sorts buyers by motive; demographics sort by identity and behavior sorts by history. Use all three together.
- The six traits are values, lifestyle, personality, interests, attitudes and buying motivation — each with a different collection method.
- VALS, Schwartz, Jobs to Be Done and AIO plus Big Five are the four frameworks worth knowing; JTBD changes roadmaps most often.
- Target roughly 400 survey completes, cluster with k-means or latent class analysis, and keep the result to three to five segments.
- Test every segment against Kotler’s five criteria, and treat reachability as the make-or-break one.
- Validate with a holdout. A segmentation that does not beat generic messaging is decoration.
Frequently Asked Questions
What is psychographic segmentation?
It is the practice of dividing a market by the psychological reasons behind purchase decisions — values, lifestyle, personality, interests, attitudes and buying motivation — rather than by demographic identity or past behavior. The goal is to explain why two otherwise identical customers make opposite choices.
What are the six psychographic variables?
Values, lifestyle, personality, interests, attitudes and buying motivation. Values and personality are relatively stable; interests and attitudes shift faster and need re-measuring every 18 to 24 months.
How is psychographic segmentation different from demographic segmentation?
Demographic segmentation describes who someone is — age, income, location, job title — and is cheap and easy to target. Psychographic segmentation describes why they buy. Two buyers with identical demographics can want opposite things from the same product, which is precisely the gap psychographics fills.
How do you collect psychographic data?
Three sources in sequence: switch interviews with recent buyers or churners to learn the language and the motives; a 15–25 item Likert survey to quantify those motives across a larger sample; and your own behavioral data joined to the survey responses so you can test whether the segments differ on retention and order value.
How many psychographic segments should a business have?
Three to five for most organizations. Fewer than three usually means you have not found a real distinction; more than five means you cannot resource distinct creative, offers and onboarding for each, and the results per segment become too thin to interpret.
Is psychographic segmentation worth it for a small business?
Yes, in a scaled-down form. You do not need a 600-response study. Add one open-text question at checkout asking what prompted the search, collect two hundred answers, and sort them by recurring motive. That gives you both a first-pass segmentation and verbatim customer language for your ad copy at almost no cost.